
Content: keelingcurve.ucsd.edu · drawdown.org · Regeneration.org · brightaction.app · coolclimate.org · depts.washington.edu/i2sea/iscfc ·
keelingcurve.ucsd.edu
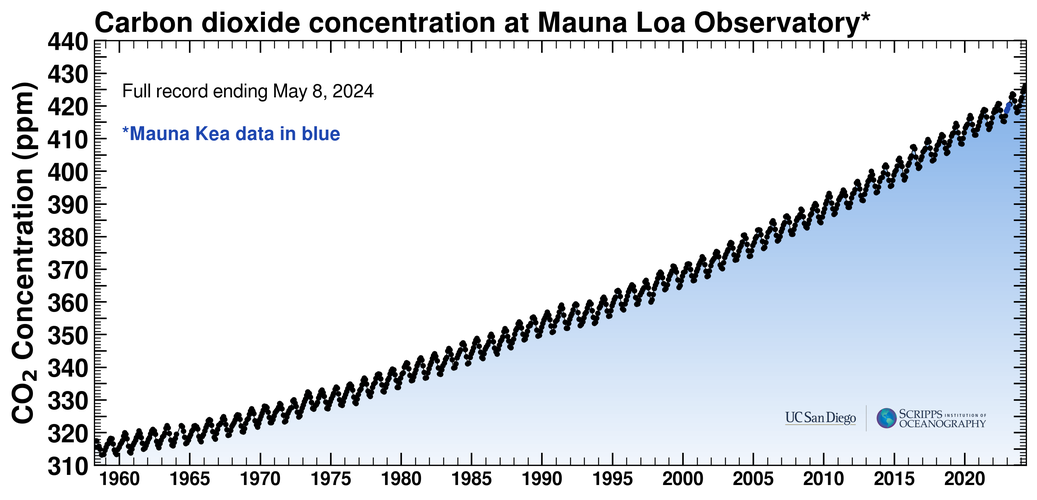
After attending the Our Changing Atmosphere workshop at the Exploratorium, I got interested in doing more research on historic CO2 data. That research led me to this this webpage that beautifully illustrates all the CO2 data we have available from a variety of data sources. The full record of CO2 measurements from Mauna Loa that we analyzed at the workshop is graphed (below) but so too is data from other sources of CO2 measurement such as from tree rings, ice cores and dried lake sediments. The graphs are updated daily as new data is collected and the website also provides an abundance of useful information on methodology behind how the data is collected and analyzed.
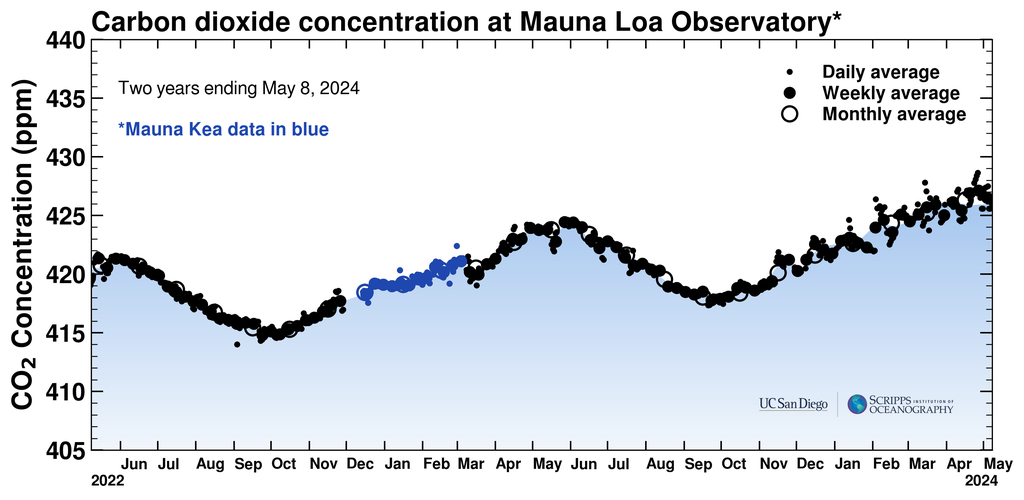
Here is the data from just two years of Mauna Loa illistrating very well the sinosoidal nature of annual CO2 measurements that we explored at the workshop.
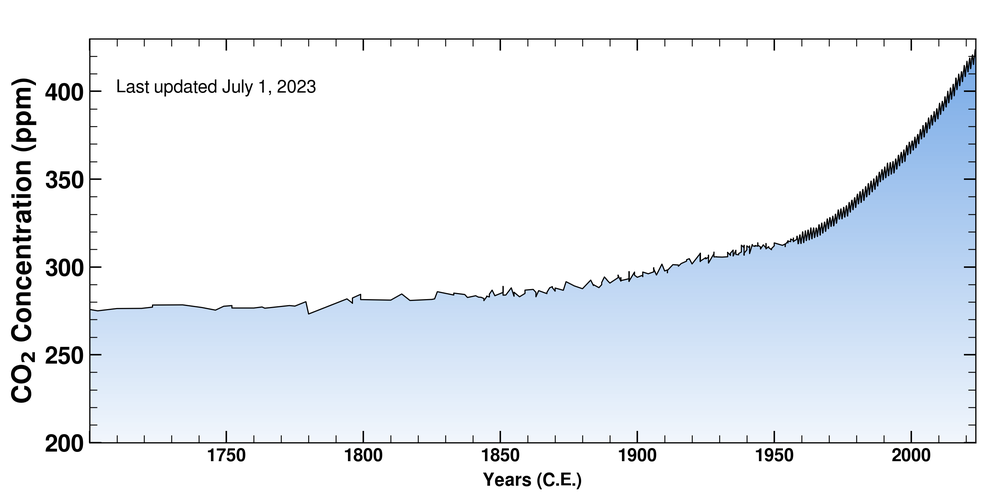
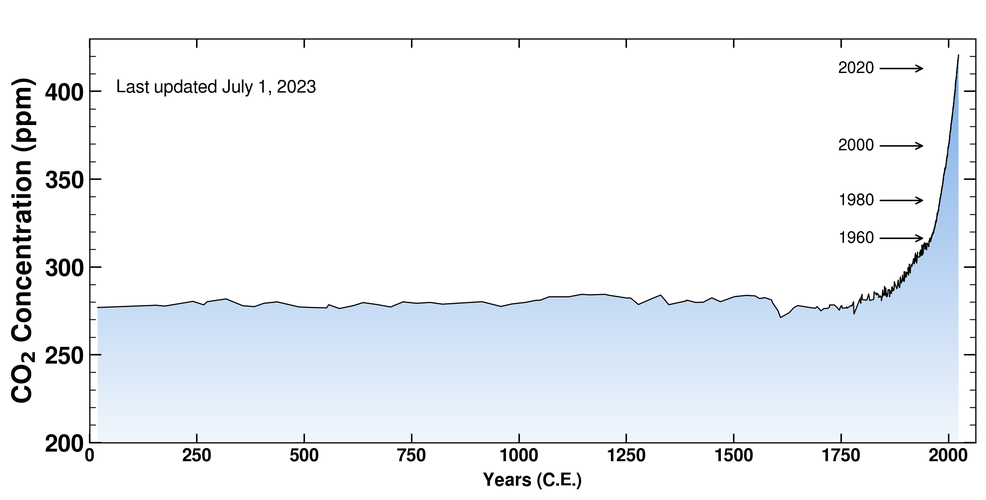
The four graphs in the gallery below show the CO2 levels from the historical data sources. They both beautifully and terrifyingly illustrate the extremity of our current CO2 derived emergency.
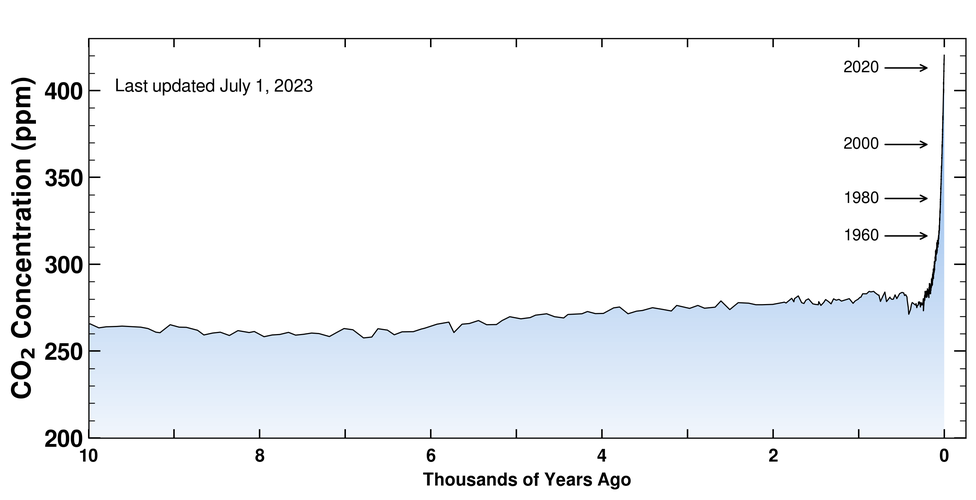
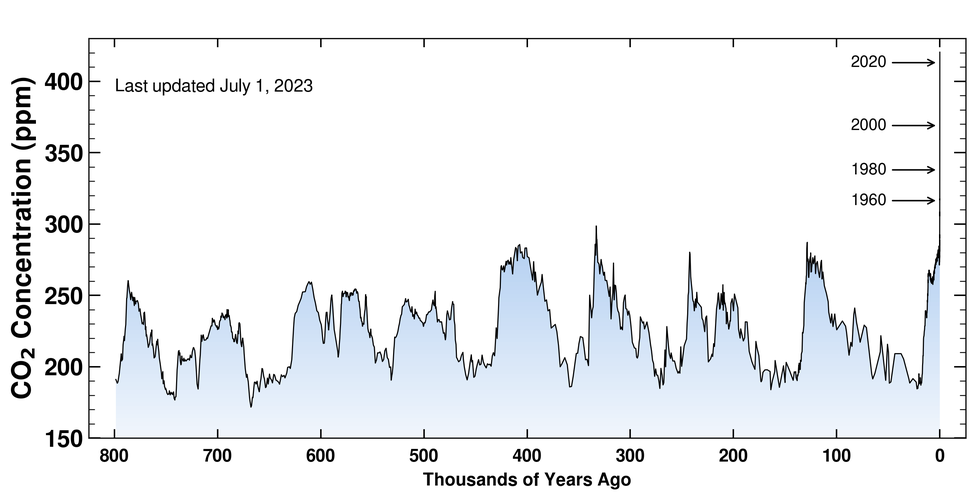
Although this website does not directly help answer my question of what we should do to solve the climate crisis, it helps illuminates essential information about the nature of the current crisis which will help provide background knowledge for myself and students about what to do about it. Namely that the extreme position we are in is due to abnormally high CO2 emissions, and any serious mitigation strategy must necessarily draw down those emissions.
drawdown.org
Project Drawdown calls itself, “The world’s leading resource for climate solutions” and would therefore seem obviously relevant to my research question. Its mission is to advance science-based climate solutions, and advocate for action in a variety of ways.
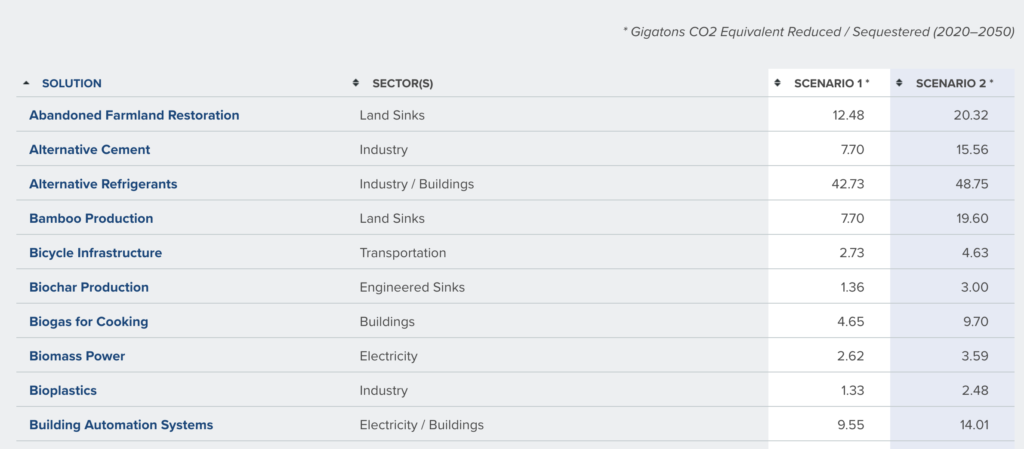
The website includes a list of nearly 100 climate change solutions which can be sorted by sector and amount of carbon reduced.
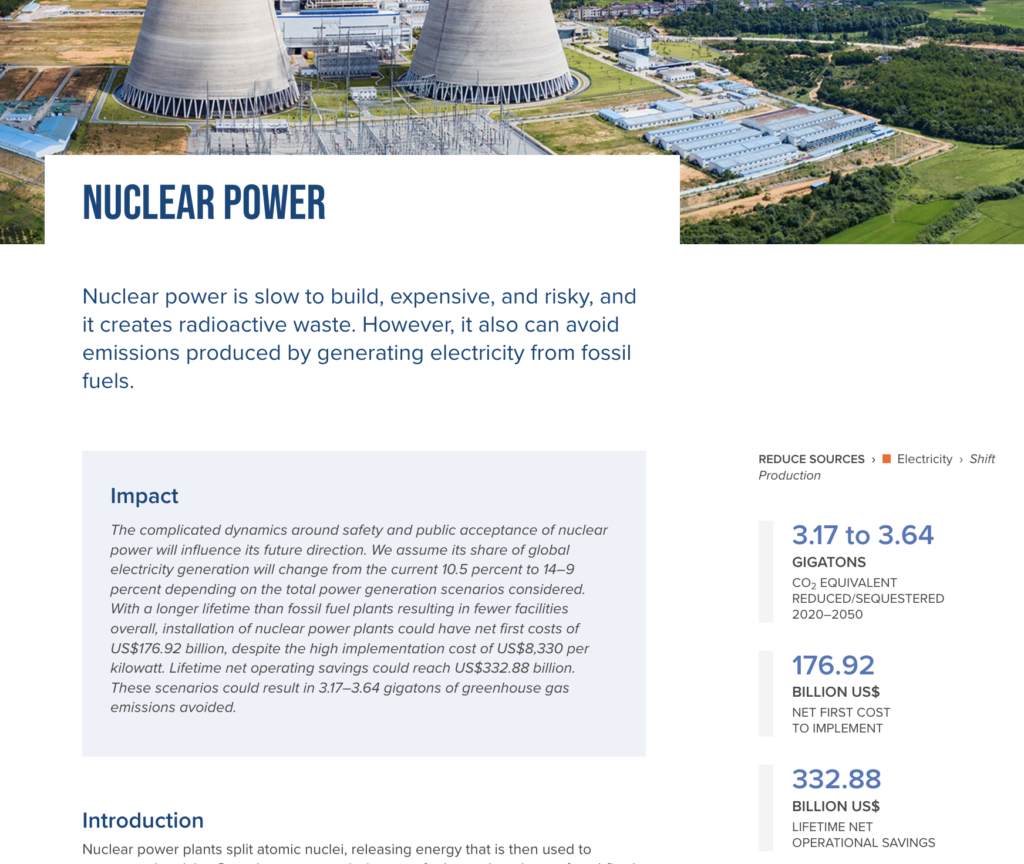
I explored some of the solutions offered and found the site to be relatively comprehensive. For each solution it offers an analysis with both benefits and drawbacks. The page on nuclear power for example (screenshot below) discusses the risks of the solution while also acknowledging the substantial impact that it can have on reducing the greenhouse gasses.
Overall this resource seems like it can be invaluable as a tool to analyze tradeoffs between different climate change mitigation strategies. What it is missing is a way to streamline that analysis as it is quite time consuming to read every article. I am sure I will be referring back to the website going forward.
Regeneration.org
This website is actually a compendium piece to the Regeneration book by Paul Hawkens. It focuses on providing concrete examples of actions that can be taken to mitigate and adapt to climate change. There are actions recommended for both individuals and communities
The website design is truly gorgeous and easy to navigate which facilitates easy comprehension and interest in the suggested climate solutions. On the website’s homepage are the scrollable images (shown below) which are linked the various climate solutions. For example clicking on the button that says urban mobility next to the image of the metro will take you to this page with many more resources on that topic. All the different suggested action can also be found on another section of the website called the nexus that collates well-referenced sources on each suggested action.


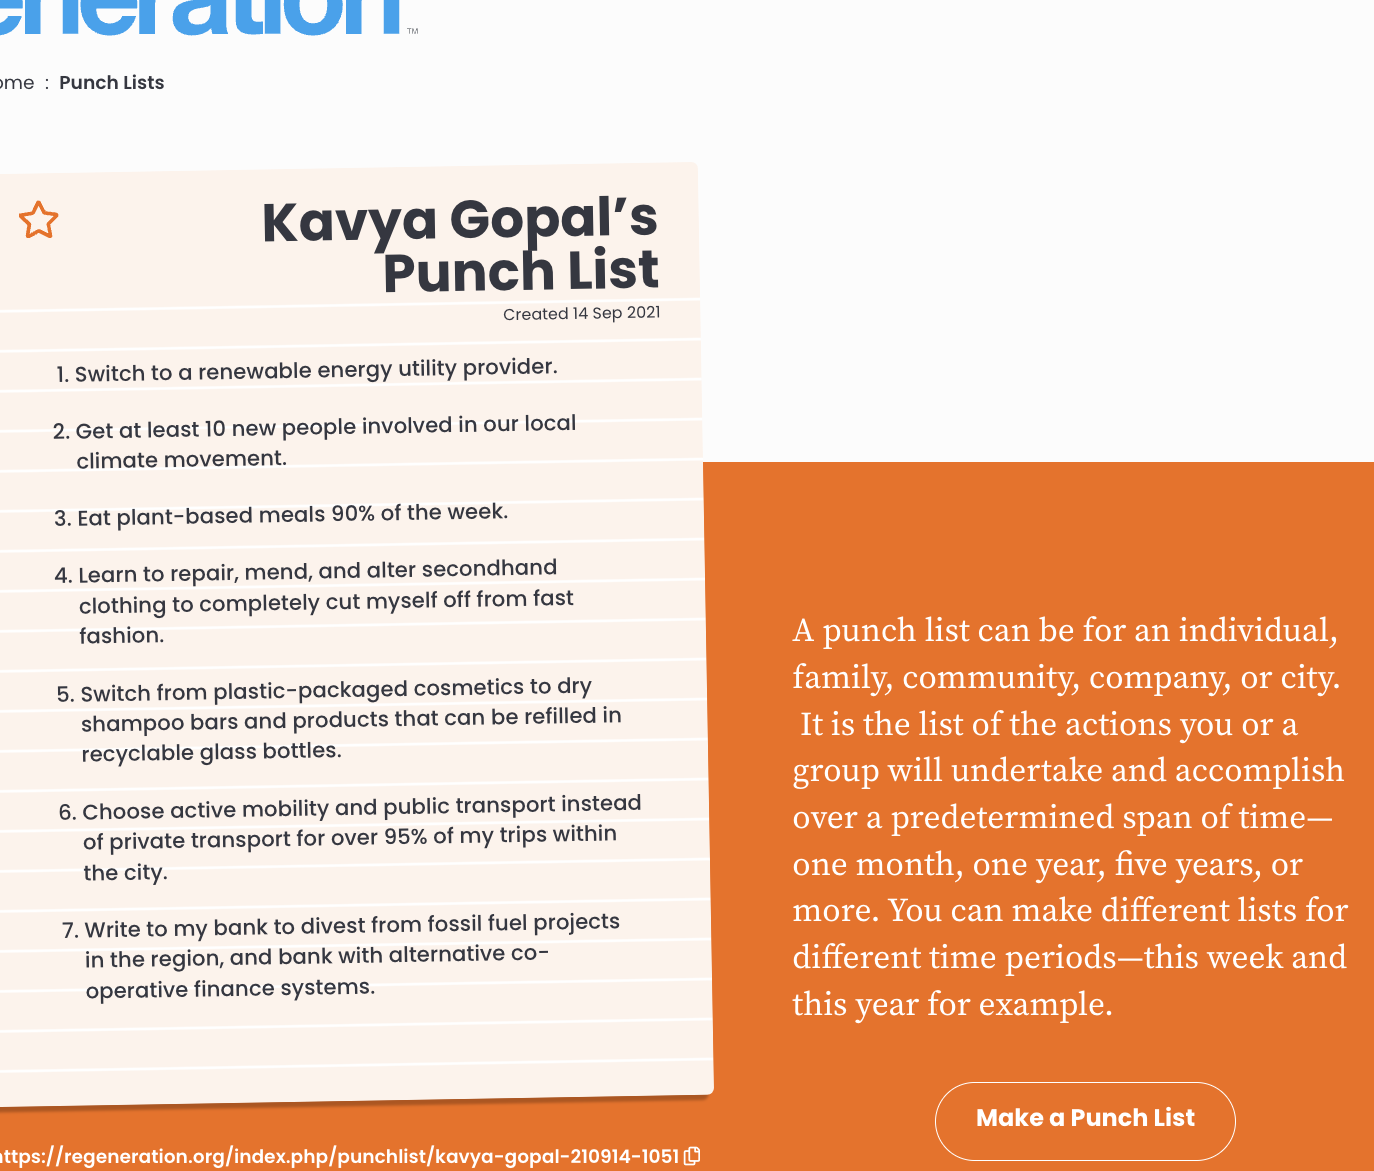
The website also features a fairly straightforward punchlist resource to share commitments that individuals and organizations can make to reduce their carbon footprint with the community of users. I like the punchlist because I think it asks individuals to answer my content question themselves by thinking about the tradeoffs that they personally are willing to make for climate change. By providing the informational surrounding resources through the Nexus, the goal would be people make informed choices about the actions that would be most meaningful.
Regeneration.org is a powerful source to add to my content resource collection as it provides so many well researched climate crisis solutions. Where it falls short is that all the solutions are presented as equally important. Because little prioritization is given, it is difficult to determine which solution one should invest energy, which is a problem for a warming world that has limited time and resources to make changes. The website also clearly has an agenda for the type of resources it presents, deemphasizing the investment in new technologies and dismissing any solution that does not present a win-win for both the climate and equity. Unlike drawdown.org there is no real attempt at a cost benefit analysis, and solutions that do not fit into the regenerative worldview are left out entirely. As such this resource ought to be utilized in concert with others that compliment the regeneration agenda.
brightaction.app
Brightaction.app is a sort of social media website and game for climate solutions. It takes data about where you live and then provides suggestions about actions you as an individual or household can do to reduce your carbon footprint. Relevant to my content question is the feature that for each action, information is provided about how costly the action will be and how much of an effect it will have. You get a kind of score based off how impactful your action will be, and you can compete against others to have the largest impact. One of the takeaways from using the tool is that the impact of different actions will vary according the specific demographics of each individual.

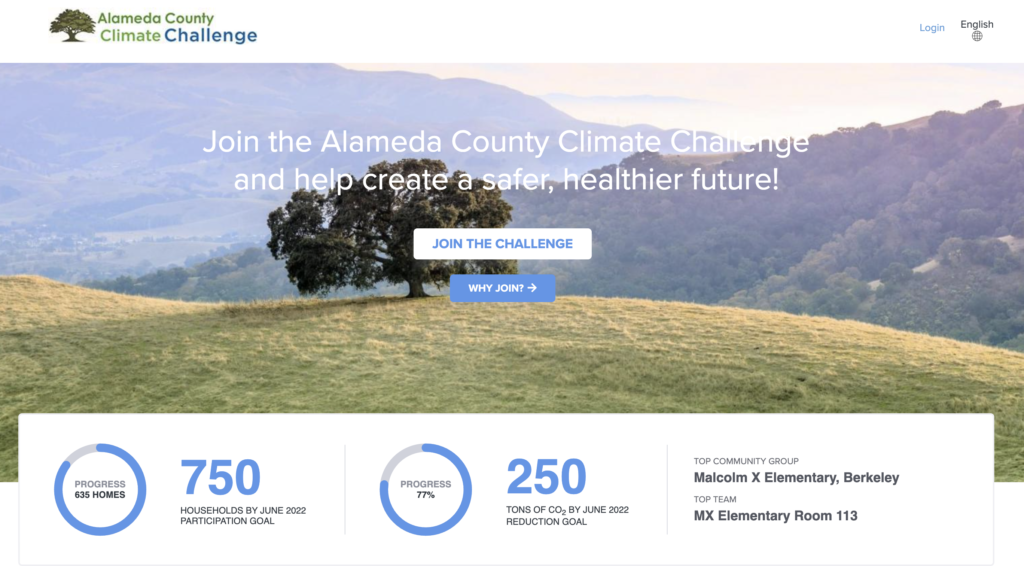
The Alameda County page (where I live and where my school is located) is relatively active and will be a great resource to share with my students as a way of helping to answer the question of what they can do.
What the website lacks is an acknowledgment of the need for larger systemic and policy actions to be prioritized over individual actions. As the Synthesis Report of the IPCC Sixth Assessment Report clearly illustrates, wholesale systemic changes are need to make a meaningful impact on the climate crisis. I worry that a website focused solely on individual action perhaps implies that personal choice alone is enough to stem climate change.
coolclimate.org
Coolclimate.org is a website run out of UC Berkeley that includes a number of exceptionally useful resources.
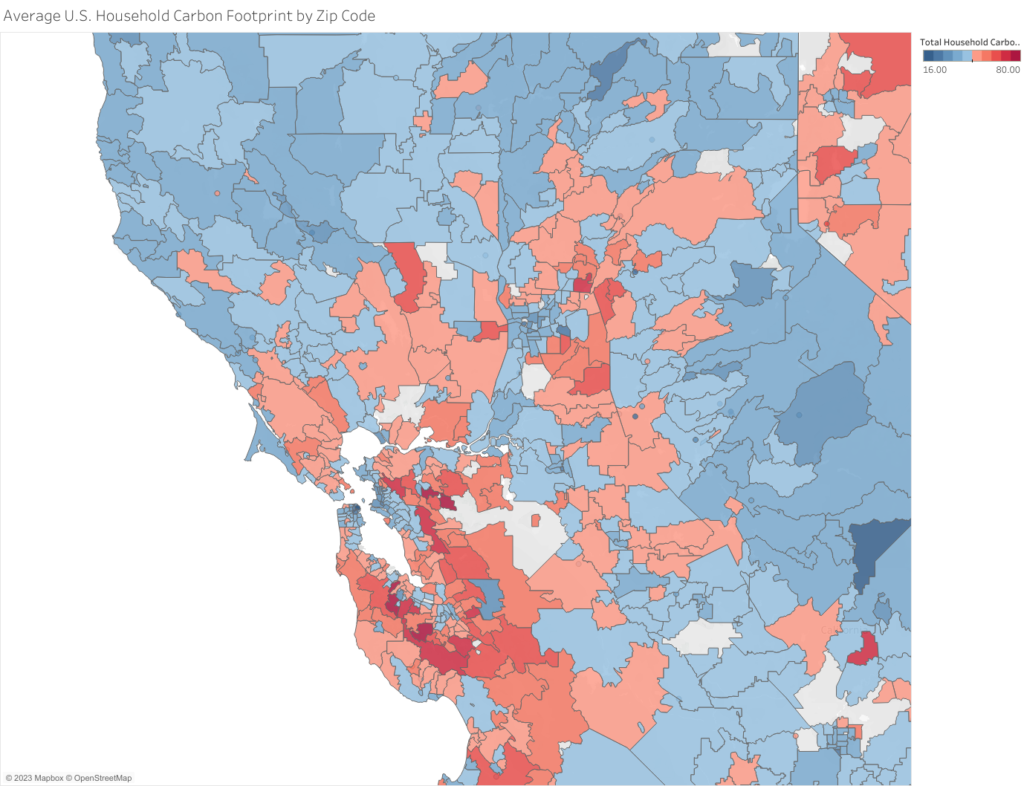
One of the most enlightening is an interactive map that the website hosts depicting the per capita carbon footprint by zip code.
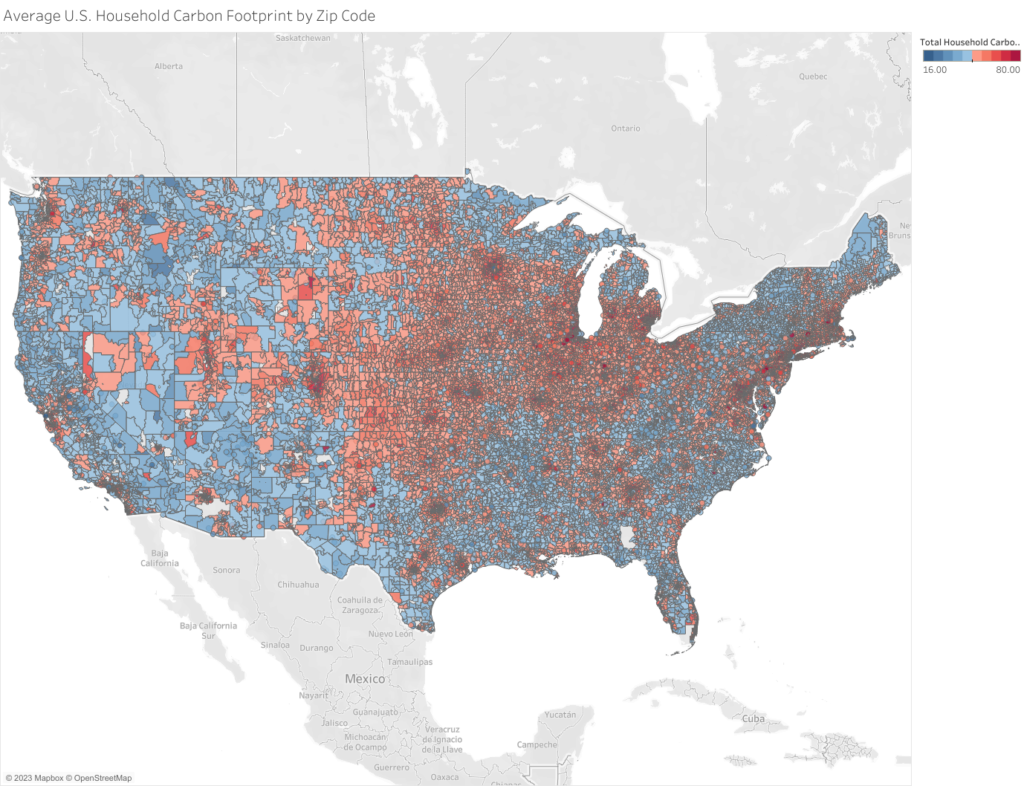
It was interesting and surprising looking in detail at the Bay Area section of the map (below) because it revealed a pattern where the places that I associate to be dense city centers such as San Francisco and Oakland have lower per capita carbon emission, but the immediately surrounding regions in the suburbs are higher.
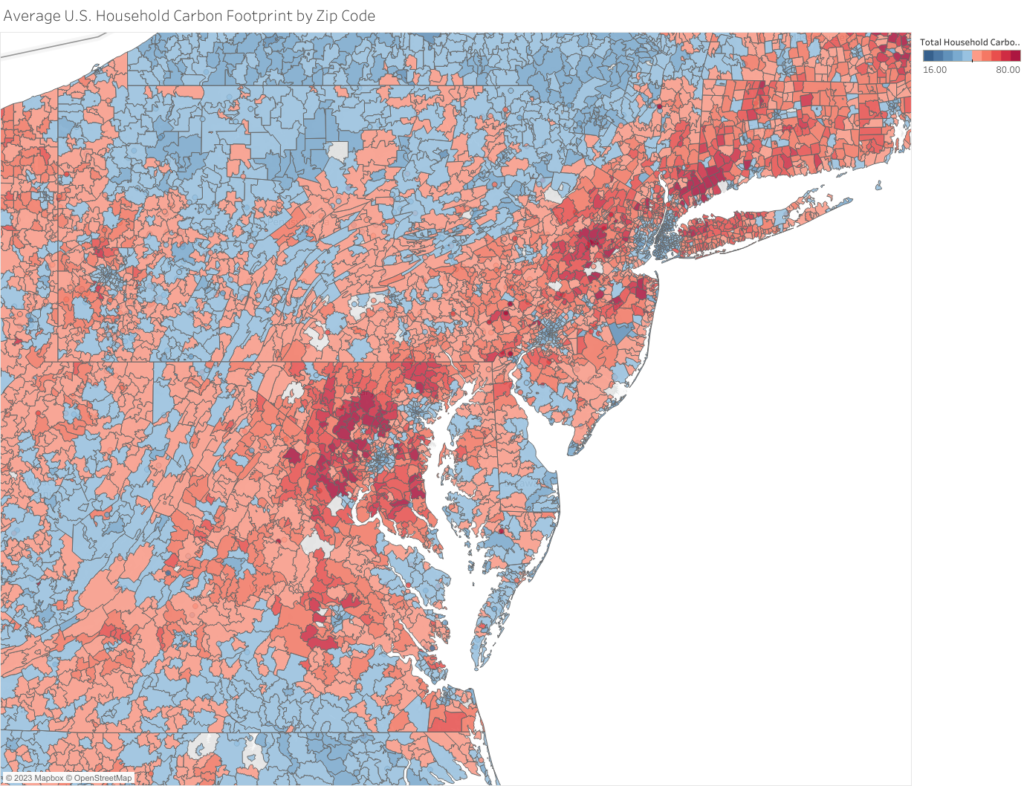
At first my instinct was to think that the pattern of low carbon emissions in city centers might be do climate policies that liberal leaning cities in the Bay Area implemented, but when I compared to the map of the Eastern United State’s large metropolis’ (below) I saw a similar pattern which implied that there was a different explanation.
My current hypothesis is that urban living inherently allows for a reduced carbon footprint due to features like easier access to public transportation, and the smaller square footage of housing that reduce electricity needs. In suburban areas by contrast, there is a need to do large commutes by car to reach urban centers, and housing tends to be much larger. If this hypothesis holds true then it provides an argument for a climate change solution strategy that incentivizes of denser urban living. I’d like to do more research to learn more. Regardless I think that this site provides a thought provoking resource to continue to explore, with many possible implications for my research question.
depts.washington.edu/i2sea/iscfc
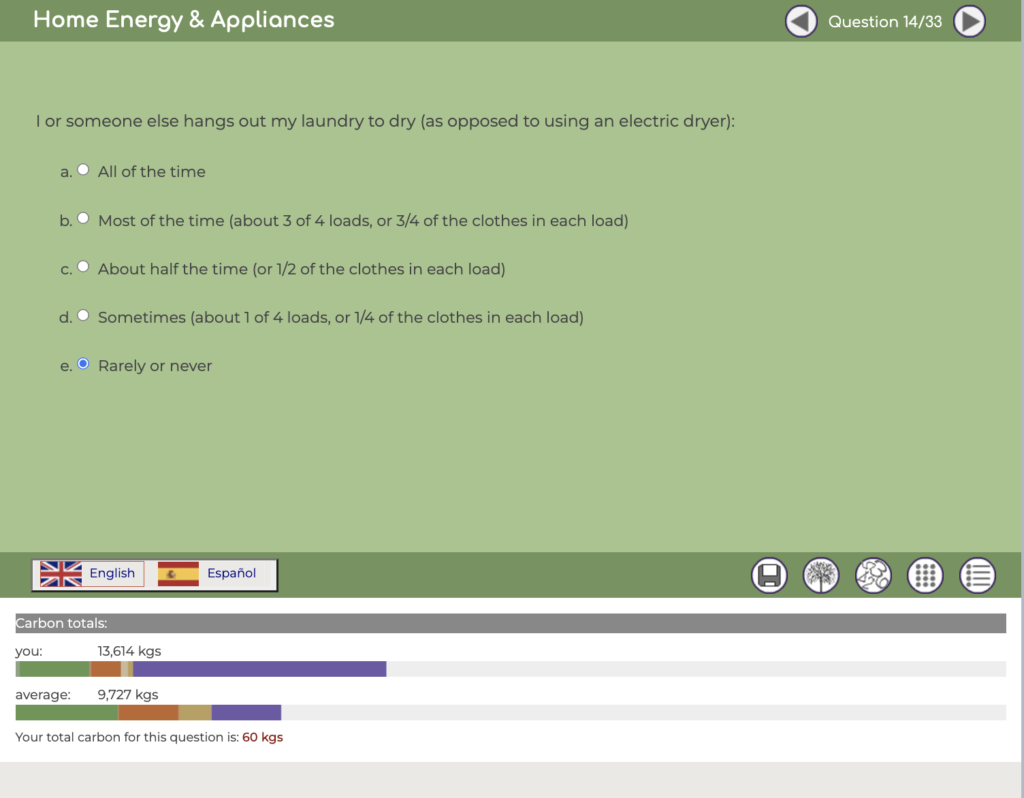
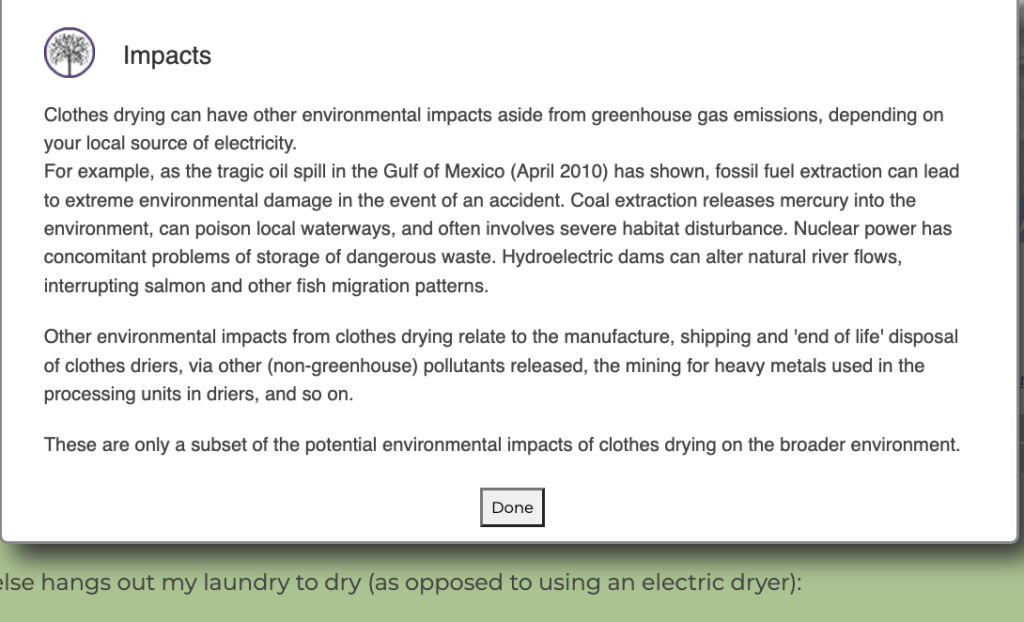
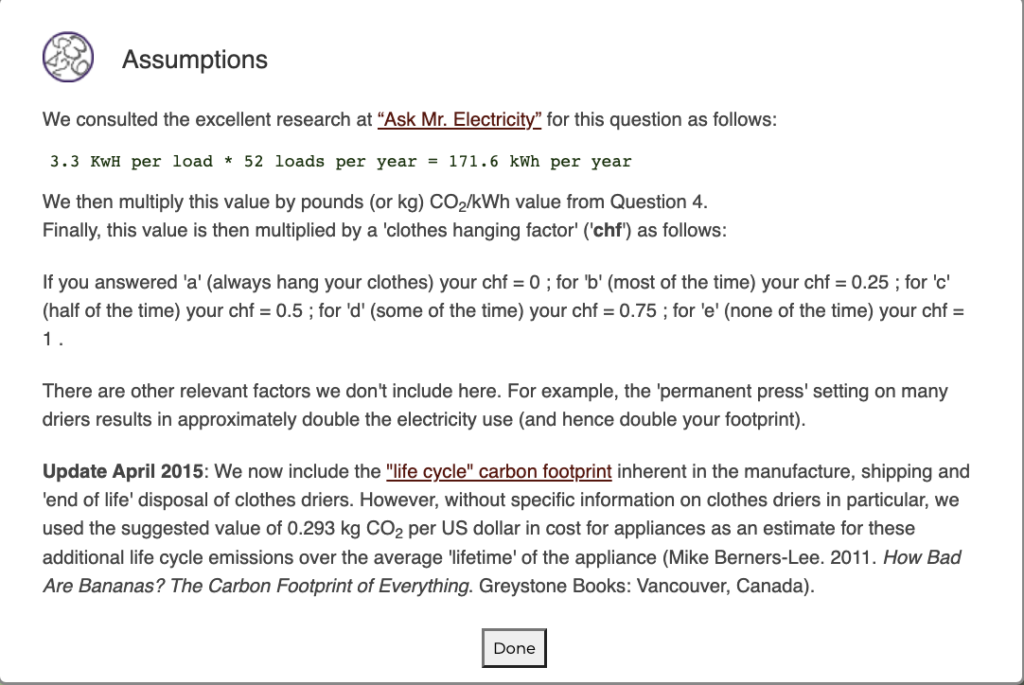
This website hosts a carbon footprint calculator that creates a profile of how much CO2 equivalent tons you emit annually based on a questionnaire that asks a number of lifestyle questions. What I like a lot about the calculator is that as you are answering questions you get an updated bar graph based on your responses telling you how much your lifestyle choice contributes to your carbon footprint. Also included are buttons that provide explanations for why your actions contribute to one’s carbon footprint, and sources are given for all the calculation assumptions. See example screenshots from when I took the quiz below.
When the quiz is over, a final readout is given with your total CO2 emission. See my report below:
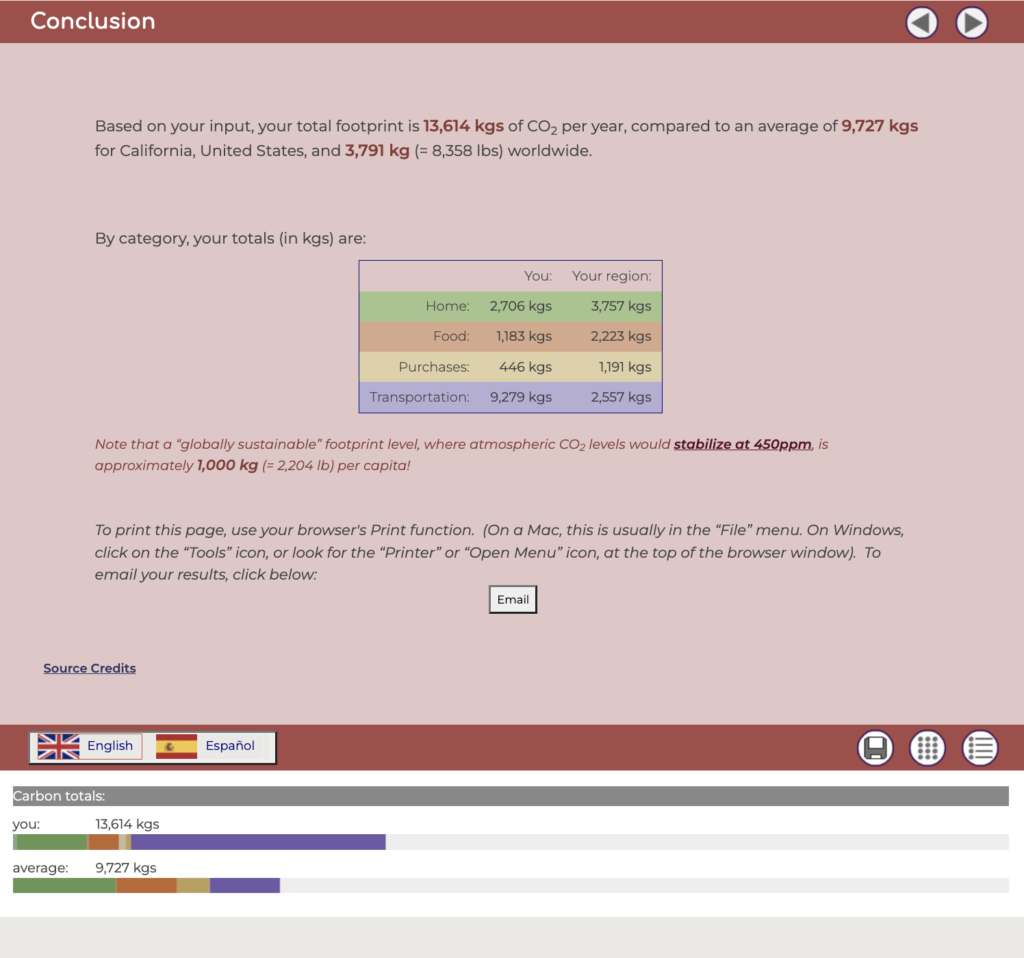
This resource is of use to my research question for a number of reasons. For one it suggests certain climate actions that an individual can take to reduce their carbon footprint by analyzing with data which lifestyle choices are most impactful. For instance my personalized report suggests that the best way for me to reduce my personal emissions would be to change my behaviors involving transportation. Most importantly I should take fewer airplane trips because my plane travel contributed 7,602 kgs of carbon, or nearly 56% of my total emissions.
While suggesting ways to change my personal carbon footprint this resource at the same time also frames climate solutions as something that needs to happen on a scale larger than the individual. As the final report says, “a ‘globally sustainable’ footprint level, where atmospheric CO2 levels would stabilize at 450ppm, is approximately 1,000 kg (= 2,204 lb) per capita!“. I redid my carbon calculation attempting to see what it would take to reduce my emissions to only 1,000 kgs and came to the conclusion that even a person who makes extreme changes to their lifestyle would find it nearly impossible to function in our present American society at those levels of emissions.
This carbon calculator therefore suggests an important answer to my research question, that although individual choice can have an impact on global emissions, in order to reach levels of emissions that are truly sustainable we need to enact broader society level changes that facilitate greener modes of living.
Click the above link to return to the content resource collection homepage, or navigate to the other sections of the Content Resource Collection below.